Contributions
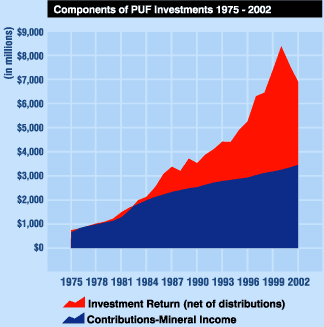
Fiscal year 2002 contributions of PUF Lands mineral income to PUF Investments decreased by 30.4% from $115.6 million to $80.5 million and represented 1.2% of the average value of PUF Investments during the year. Unfortunately, the depletion of mineral resources on PUF Lands has resulted in a steady decline in annual contributions to the PUF for the past 25 years. Therefore, growth of the PUF through PUF Lands' contributions will not be able to sustain the distributions needed to fund the many important programs earmarked by the institutions and agencies of UT System and TAMU System. Today, preservation of PUF endowment purchasing power is critically dependent on retained investment return as evidenced by examining the components of growth in the value of PUF Investments since 1975.

Click to print charts in this section using PDF format
Investment Return
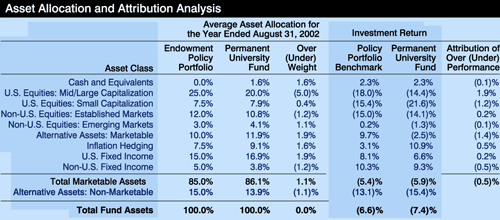
The PUF posted a net negative return of 7.4% (net of investment management fees) for the year ended August 31, 2002. The chart below presents the PUF's performance compared to the Endowment Policy Portfolio. The attribution analysis, appropriate for marketable assets only, indicates how each asset class contributed to the aggregate performance of the PUF relative to the Endowment Policy Portfolio. The PUF's marketable assets' return of negative 5.9% underperformed the negative 5.4% benchmark return by .5%

Click to print charts in this section using PDF format
Investment Expenses
Total expenses related to the management of PUF Investments were $15.8 million during 2002 versus $13.1 million in 2001, an increase of 20.6%. This increase in expenses was due primarily to increased performance fees paid to certain external managers because of superior returns relative to their benchmark. PUF expenses represent .22% and .17% of PUF's average net asset value during the years ended August 31, 2002 and 2001, respectively.
Preservation of PUF Investments Purchasing Power
Preserving PUF Investments purchasing power over time is dependent on the PUF's ability to meet its distribution policy objectives. PUF distribution policy objectives are to:
- Provide a predictable, stable stream of distributions over time
For the preceding five-year period, starting with the fiscal year ended August 1998, the rate of change in the PUF's annual distribution was (2.0%), 1.5%, 12.8%, 6.6% and 6.7%, respectively.
- Ensure that the inflation adjusted value of distributions is maintained over the long-term
The UT Board has established a distribution policy that provides stable, inflation adjusted annual distributions to the AUF and preserves the real value of the PUF Investments over the long-term. To achieve this, the annual distribution was established at 4.75% of the prior twelve quarters' average net asset value of the PUF determined each February 28 for the following fiscal year.
- Ensure that the inflation adjusted value of PUF Investments after distributions is maintained over the long-term
Maintaining purchasing power of PUF Investments should be viewed over long-term investment cycles. Despite investment losses for fiscal year 2002 and years of overweighting lower returning fixed income investments in the PUF before the "total return" distribution policy was adopted, the purchasing power of PUF Investments for the ten-year period ending August 31, 2002, increased by an average of 1.19% after all expenses and distributions as detailed in the following table:
next >>

