|
Investment Return and Market Commentary
 |
|
The University of Texas Southwestern Medical Center at Dallas
|
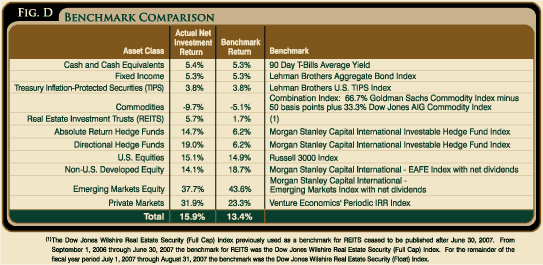
The LTF posted a net investment return of 15.8% for the year ended August 31, 2007. The LTF derives it return mainly from the shares it owns in the GEF. The LTF's return is slightly less than the GEF's return due to additional expenses incurred by the LTF. The GEF posted a net investment return of 15.9%. All asset categories of the GEF posted positive returns for the year, with the exception of commodities. The emerging markets equities (+37.7%), private markets (+31.9%), and directional hedge funds (+19.0%) asset categories led the strong relative and absolute returns across the overall portfolio.
The GEF's assets remain approximately 40% invested in global public equities, with about half of this exposure in U.S. domiciled companies and a quarter each in non-U.S. developed countries and emerging market countries. During the fiscal year, the U.S. equity markets delivered 15% returns, the non-U.S. developed country markets returned 19% and emerging markets generated 44% returns. The GEF benefited from a slightly overweight position in emerging markets relative to its policy portfolio benchmark. However, the value-add from active managers in the non-U.S. developed countries and emerging markets was disappointing. These are areas UTIMCO staff will be focusing on in the coming year.
Approximately 25% of the GEF's assets are invested in directional and absolute return hedge funds which produced investment returns of 16.2%, with relatively low volatility and low correlation with the underlying asset classes in which they are investing. The hedge fund portfolio performance was especially strong given that the average hedge fund across the industry produced only a 6.2% return during this period.
Fixed income investments - including nominal and real bonds across the maturity spectrum - are targeted at 15% of the GEF's assets. The GEF remained slightly underweight in these assets, as well as invested in durations shorter than the benchmarks. Altogether, fixed income returns were close to the policy portfolio benchmark.
 |
|
The University of Texas Health Science Center at Houston
|
Private markets investments including venture capital, buyouts, distressed and opportunistic strategies, and energy-related strategies totaled just over 12% of the GEF's investments, which was lower than the 15% policy portfolio target due to accelerated distributions. Private market investments returned 31.9% for the year, which surpassed the average returns for private investment funds by 8.6%.
Finally, the GEF had approximately 7% of its assets invested in commodities and REITS. REIT returns were positive for the year, and the GEF's managers delivered positive performance versus their benchmarks. Commodity returns - driven largely by the price of oil - were negative for the year.
As noted above, fiscal year 2007 capital markets provided an environment for strong returns. That said, the positive and relatively benign environment for the first ten and a half months of the fiscal year, came to an abrupt halt in the second half of July.
Despite a string of rate increases on the part of the United States Federal Reserve System (the "Fed"), long rates remained stable resulting in a relatively flat yield curve hovering just under 5% through mid July. Fears of sub-prime mortgage losses and 'contagion' resulted in extremely volatile fixed income markets during the final 45 days of the fiscal year as short-term U.S. Treasury yields plummeted and LIBOR skyrocketed. At the time of this writing, the Fed's easing appears to have calmed the fixed income markets, at least for now.
European fixed income markets were not dissimilar from the U.S. markets, although Japanese fixed income yields remained quite low in the face of continued anemic domestic economic growth. Emerging market fixed income spreads remained historically low as these economies appear to have transformed themselves from net borrowers to net lenders.
Riding on the benign fixed income markets, equity markets posted strong gains as economic expansion continued and inflation appeared tame. As mentioned above, the U.S. equity markets gained 15%, non-U.S. developed market equities increased 19% and emerging market equities returned an incredible 44% for the year. Private equity buyout activity was strong, generating healthy distributions through recapitalizations and sales while plentiful debt funded new investment activity. While the end of the fiscal year brought about an abrupt slowdown to private equity activity, the public equity markets staggered, but then recovered, and appear to be yet again reaching new heights.
Energy prices traded a bit down for the year (albeit arguably at high levels) while other commodities ranging from metals and minerals to agriculture and livestock continued their upward trend in the face of strong global demand and constrained supplies.
 |
|
The University of Texas - Pan American
|
Conflicting cross-currents make the coming year a difficult one to predict. On a strategic level, the entrance of three billion participants in the world economy (e.g., China, India, Russia, etc.) is still in the early stages. This fundamental increase in productive capability, and consequently consumer demand, should propel global economic growth forward. Countering this the U.S. economy appears to be slowing as consumption in excess of production can only continue for so long before the party must wind down. Together with the aging populations in the U.S., Europe and Japan, and the continuing relative impediments to market competition in Europe and Japan, headwinds exist.
The depth and breadth of contractions in liquidity in certain markets, which was initiated by the sub-prime mortgage losses triggering a switch from 'greed' to 'fear' (more elegantly referred to as the 're-pricing of risk') - but being battled by the Fed's interest rate easing - remains to be seen.

Click to print charts in this section using PDF format
Figure D reports the GEF's investment results by asset class compared to each individual benchmark for the year ended August 31, 2007.
|